Test of holoviews
Some of these plots are pretty advanced, so they may not render properly. Try to click some buttons and zoom in to explore full functionality
1. Built-in example
import holoviews as hv
from holoviews import opts
hv.extension('bokeh')
#Declaring data
from bokeh.sampledata.iris import flowers
from holoviews.operation import gridmatrix
ds = hv.Dataset(flowers)
grouped_by_species = ds.groupby('species', container_type=hv.NdOverlay)
grid = gridmatrix(grouped_by_species, diagonal_type=hv.Scatter)
#Plot
grid.opts(opts.Scatter(tools=['hover', 'box_select'], bgcolor='#efe8e2', fill_alpha=0.2, size=4))
2. Coupled van der Pol oscillators
title: Coupled van der Pol oscillators
description:
date: 2020-04-30
tags:
math
layout: layouts/post.njk
Coupled van der Pol oscillators https://scholarsarchive.library.albany.edu/cgi/viewcontent.cgi?article=1004&context=honorscollege_physics
$ g’ = A sin ωt − γg − ω^2_0 z$
\(z' = g\)
from models.coupled.vanderpol import *
import matplotlib.pylab as plt
hv.notebook_extension()
van=get_plot()
van[0]
van
import numpy as np
from holoviews import HoloMap, VectorField
#%load_ext holoviews.ipython
%output filename="Image-Pattern-Gaussian" holomap="gif"
holomap = HoloMap()
steps = np.linspace(-2.5, 2.5, 41)
x,y = np.meshgrid(steps, steps)
sine_rings = np.sin(x**2+y**2)*np.pi+np.pi
exp_falloff = 1/np.exp((x**2+y**2)/15)
for deg in np.linspace(0, 360, 128, endpoint=False):
vector_data = np.array([x.flatten()/5., y.flatten()/5.,
np.sin(deg*2*np.pi/360)*sine_rings.flatten(),
exp_falloff.flatten()]).T
holomap[deg] = VectorField(vector_data, group='Sine Ring').opts(backend='bokeh')
holomap
---------------------------------------------------------------------------
ModuleNotFoundError Traceback (most recent call last)
~/python3.7/lib/python3.7/site-packages/bokeh/util/dependencies.py in import_required(mod_name, error_msg)
78 try:
---> 79 return import_module(mod_name)
80 except ImportError as e:
~/python3.7/lib/python3.7/importlib/__init__.py in import_module(name, package)
126 level += 1
--> 127 return _bootstrap._gcd_import(name[level:], package, level)
128
~/python3.7/lib/python3.7/importlib/_bootstrap.py in _gcd_import(name, package, level)
~/python3.7/lib/python3.7/importlib/_bootstrap.py in _find_and_load(name, import_)
~/python3.7/lib/python3.7/importlib/_bootstrap.py in _find_and_load_unlocked(name, import_)
~/python3.7/lib/python3.7/importlib/_bootstrap.py in _call_with_frames_removed(f, *args, **kwds)
~/python3.7/lib/python3.7/importlib/_bootstrap.py in _gcd_import(name, package, level)
~/python3.7/lib/python3.7/importlib/_bootstrap.py in _find_and_load(name, import_)
~/python3.7/lib/python3.7/importlib/_bootstrap.py in _find_and_load_unlocked(name, import_)
ModuleNotFoundError: No module named 'selenium'
The above exception was the direct cause of the following exception:
RuntimeError Traceback (most recent call last)
~/python3.7/lib/python3.7/site-packages/IPython/core/formatters.py in __call__(self, obj, include, exclude)
968
969 if method is not None:
--> 970 return method(include=include, exclude=exclude)
971 return None
972 else:
~/python3.7/lib/python3.7/site-packages/holoviews/core/dimension.py in _repr_mimebundle_(self, include, exclude)
1310 combined and returned.
1311 """
-> 1312 return Store.render(self)
1313
1314
~/python3.7/lib/python3.7/site-packages/holoviews/core/options.py in render(cls, obj)
1393 data, metadata = {}, {}
1394 for hook in hooks:
-> 1395 ret = hook(obj)
1396 if ret is None:
1397 continue
~/python3.7/lib/python3.7/site-packages/holoviews/ipython/display_hooks.py in pprint_display(obj)
280 if not ip.display_formatter.formatters['text/plain'].pprint:
281 return None
--> 282 return display(obj, raw_output=True)
283
284
~/python3.7/lib/python3.7/site-packages/holoviews/ipython/display_hooks.py in display(obj, raw_output, **kwargs)
256 elif isinstance(obj, (HoloMap, DynamicMap)):
257 with option_state(obj):
--> 258 output = map_display(obj)
259 elif isinstance(obj, Plot):
260 output = render(obj)
~/python3.7/lib/python3.7/site-packages/holoviews/ipython/display_hooks.py in wrapped(element)
144 try:
145 max_frames = OutputSettings.options['max_frames']
--> 146 mimebundle = fn(element, max_frames=max_frames)
147 if mimebundle is None:
148 return {}, {}
~/python3.7/lib/python3.7/site-packages/holoviews/ipython/display_hooks.py in map_display(vmap, max_frames)
204 return None
205
--> 206 return render(vmap)
207
208
~/python3.7/lib/python3.7/site-packages/holoviews/ipython/display_hooks.py in render(obj, **kwargs)
66 renderer = renderer.instance(fig='png')
67
---> 68 return renderer.components(obj, **kwargs)
69
70
~/python3.7/lib/python3.7/site-packages/holoviews/plotting/renderer.py in components(self, obj, fmt, comm, **kwargs)
426 return data, {}
427 else:
--> 428 html = self._figure_data(plot, fmt, as_script=True, **kwargs)
429 data['text/html'] = html
430
~/python3.7/lib/python3.7/site-packages/holoviews/plotting/bokeh/renderer.py in _figure_data(self, plot, fmt, doc, as_script, **kwargs)
104 if fmt == 'gif':
105 from bokeh.io.export import get_screenshot_as_png
--> 106 from bokeh.io.webdriver import webdriver_control
107
108 if state.webdriver is None:
~/python3.7/lib/python3.7/site-packages/bokeh/io/webdriver.py in <module>
21 from ..util.dependencies import import_required # isort:skip
22 import_required("selenium.webdriver",
---> 23 "To use bokeh.io image export functions you need selenium "
24 "('conda install selenium' or 'pip install selenium')")
25
~/python3.7/lib/python3.7/site-packages/bokeh/util/dependencies.py in import_required(mod_name, error_msg)
79 return import_module(mod_name)
80 except ImportError as e:
---> 81 raise RuntimeError(error_msg) from e
82
83 #-----------------------------------------------------------------------------
RuntimeError: To use bokeh.io image export functions you need selenium ('conda install selenium' or 'pip install selenium')
:HoloMap [Default]
:VectorField [x,y] (Angle,Magnitude)
hmap = hv.HoloMap({i: hv.Curve([1, 2, i]) for i in range(10)})
#hv.output(hmap, holomap='gif', fps=3, backend='matplotlib')
hv.output(hmap, holomap='gif', fps=3, backend='bokeh')
#hv.output(hmap, holomap='gif', fps=3, backend='plotly')
---------------------------------------------------------------------------
ModuleNotFoundError Traceback (most recent call last)
~/python3.7/lib/python3.7/site-packages/bokeh/util/dependencies.py in import_required(mod_name, error_msg)
78 try:
---> 79 return import_module(mod_name)
80 except ImportError as e:
~/python3.7/lib/python3.7/importlib/__init__.py in import_module(name, package)
126 level += 1
--> 127 return _bootstrap._gcd_import(name[level:], package, level)
128
~/python3.7/lib/python3.7/importlib/_bootstrap.py in _gcd_import(name, package, level)
~/python3.7/lib/python3.7/importlib/_bootstrap.py in _find_and_load(name, import_)
~/python3.7/lib/python3.7/importlib/_bootstrap.py in _find_and_load_unlocked(name, import_)
~/python3.7/lib/python3.7/importlib/_bootstrap.py in _call_with_frames_removed(f, *args, **kwds)
~/python3.7/lib/python3.7/importlib/_bootstrap.py in _gcd_import(name, package, level)
~/python3.7/lib/python3.7/importlib/_bootstrap.py in _find_and_load(name, import_)
~/python3.7/lib/python3.7/importlib/_bootstrap.py in _find_and_load_unlocked(name, import_)
ModuleNotFoundError: No module named 'selenium'
The above exception was the direct cause of the following exception:
RuntimeError Traceback (most recent call last)
~/python3.7/lib/python3.7/site-packages/IPython/core/formatters.py in __call__(self, obj, include, exclude)
968
969 if method is not None:
--> 970 return method(include=include, exclude=exclude)
971 return None
972 else:
~/python3.7/lib/python3.7/site-packages/holoviews/core/dimension.py in _repr_mimebundle_(self, include, exclude)
1310 combined and returned.
1311 """
-> 1312 return Store.render(self)
1313
1314
~/python3.7/lib/python3.7/site-packages/holoviews/core/options.py in render(cls, obj)
1393 data, metadata = {}, {}
1394 for hook in hooks:
-> 1395 ret = hook(obj)
1396 if ret is None:
1397 continue
~/python3.7/lib/python3.7/site-packages/holoviews/ipython/display_hooks.py in pprint_display(obj)
280 if not ip.display_formatter.formatters['text/plain'].pprint:
281 return None
--> 282 return display(obj, raw_output=True)
283
284
~/python3.7/lib/python3.7/site-packages/holoviews/ipython/display_hooks.py in display(obj, raw_output, **kwargs)
256 elif isinstance(obj, (HoloMap, DynamicMap)):
257 with option_state(obj):
--> 258 output = map_display(obj)
259 elif isinstance(obj, Plot):
260 output = render(obj)
~/python3.7/lib/python3.7/site-packages/holoviews/ipython/display_hooks.py in wrapped(element)
144 try:
145 max_frames = OutputSettings.options['max_frames']
--> 146 mimebundle = fn(element, max_frames=max_frames)
147 if mimebundle is None:
148 return {}, {}
~/python3.7/lib/python3.7/site-packages/holoviews/ipython/display_hooks.py in map_display(vmap, max_frames)
204 return None
205
--> 206 return render(vmap)
207
208
~/python3.7/lib/python3.7/site-packages/holoviews/ipython/display_hooks.py in render(obj, **kwargs)
66 renderer = renderer.instance(fig='png')
67
---> 68 return renderer.components(obj, **kwargs)
69
70
~/python3.7/lib/python3.7/site-packages/holoviews/plotting/renderer.py in components(self, obj, fmt, comm, **kwargs)
426 return data, {}
427 else:
--> 428 html = self._figure_data(plot, fmt, as_script=True, **kwargs)
429 data['text/html'] = html
430
~/python3.7/lib/python3.7/site-packages/holoviews/plotting/bokeh/renderer.py in _figure_data(self, plot, fmt, doc, as_script, **kwargs)
104 if fmt == 'gif':
105 from bokeh.io.export import get_screenshot_as_png
--> 106 from bokeh.io.webdriver import webdriver_control
107
108 if state.webdriver is None:
~/python3.7/lib/python3.7/site-packages/bokeh/io/webdriver.py in <module>
21 from ..util.dependencies import import_required # isort:skip
22 import_required("selenium.webdriver",
---> 23 "To use bokeh.io image export functions you need selenium "
24 "('conda install selenium' or 'pip install selenium')")
25
~/python3.7/lib/python3.7/site-packages/bokeh/util/dependencies.py in import_required(mod_name, error_msg)
79 return import_module(mod_name)
80 except ImportError as e:
---> 81 raise RuntimeError(error_msg) from e
82
83 #-----------------------------------------------------------------------------
RuntimeError: To use bokeh.io image export functions you need selenium ('conda install selenium' or 'pip install selenium')
:HoloMap [Default]
:Curve [x] (y)
import panel as pn
pn.extension('vega')
#This example demonstrates how to link Panel widgets to a Vega pane by editing the Vega spec using callbacks and triggering updates in the plot.
imdb = {
"$schema": "https://vega.github.io/schema/vega-lite/v3.json",
"data": {"url": "https://raw.githubusercontent.com/vega/vega/master/docs/data/movies.json"},
"transform": [{
"filter": {"and": [
{"field": "IMDB_Rating", "valid": True},
{"field": "Rotten_Tomatoes_Rating", "valid": True}
]}
}],
"mark": "rect",
"width": 600,
"height": 400,
"encoding": {
"x": {
"bin": {"maxbins":60},
"field": "IMDB_Rating",
"type": "quantitative"
},
"y": {
"bin": {"maxbins": 40},
"field": "Rotten_Tomatoes_Rating",
"type": "quantitative"
},
"color": {
"aggregate": "count",
"type": "quantitative"
}
},
"config": {
"view": {
"stroke": "transparent"
}
}
}
vega = pn.pane.Vega(imdb, width=750, height=425)
# Declare range slider to adjust the color limits
color_lims = pn.widgets.RangeSlider(name='Color limits', start=0, end=125, value=(0, 40), step=1)
color_lims.jslink(vega, code={'value': """
target.data.encoding.color.scale = {domain: source.value};
target.properties.data.change.emit()
"""})
# Declare slider to control the number of bins along the x-axis
imdb_bins = pn.widgets.IntSlider(name='IMDB Ratings Bins', start=0, end=125, value=60, step=25)
imdb_bins.jslink(vega, code={'value': """
target.data.encoding.x.bin.maxbins = source.value;
target.properties.data.change.emit()
"""})
# Declare slider to control the number of bins along the y-axis
tomato_bins = pn.widgets.IntSlider(name='Rotten Tomato Ratings Bins', start=0, end=125, value=40, step=25)
tomato_bins.jslink(vega, code={'value': """
target.data.encoding.y.bin.maxbins = source.value;
target.properties.data.change.emit()
"""})
pn.Row(vega, pn.Column(color_lims, imdb_bins, tomato_bins))
WARNING:param.panel_extension: A HoloViz extension was loaded previously. This means the extension is already initialized and the following Panel extensions could not be properly loaded: ['vega']. If you are loading custom extensions with pn.extension(...) ensure that this is called before any other HoloViz extension such as hvPlot or HoloViews.
#import holoviews as hv
#hv.renderer('matplotlib').save(van[0], 'test', fmt='gif')
#%output filename="tmp" holomap='gif'
#van[0]
ω0 = 2500
ν = 100
µ = 10
ω2 = 300*25#554.365
A2=0
def deriv (y,t,A1,ω1):
sine1=A1*np.sin(ω1 * t)
sine2=A1*np.sin(ω2 *t)
zprime = y[1]
gprime = -ν *y[1]*(y[0]**2 - µ) - (ω0**2) * y[0] + sine1 + sine2
return np.array([ zprime , gprime, sine1 ])
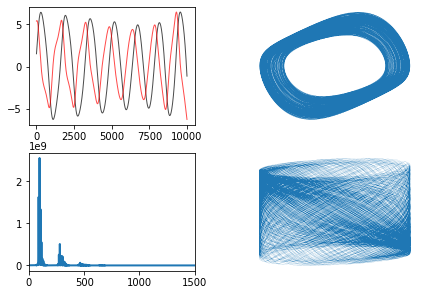
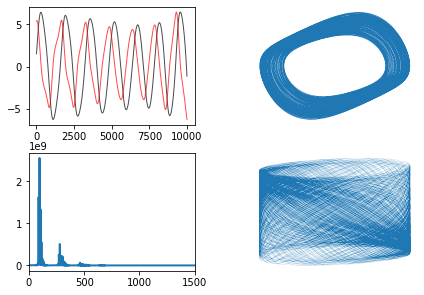
def plot_and_play(y):
# tstep=t[1] - t[0]
def plotyy(y1, y2, titul1='Y1', titul2='Y2', x=None):
"""
:param y1:
:param y2:
:param titul1:
:param titul2:
:param x:
:return:
"""
if x is None:
x = range(len(y1))
# plt.clf()
ax1, ax2 = (plt.gca(), plt.twinx())
if len(y1) < 1000: # plot dots if small sample
ax1.plot(x, y1, 'k+', markersize=2, alpha=1)
ax2.plot(x, y2, 'r.', markersize=2, alpha=.5)
ax1.plot(x, y1, 'k-', linewidth=1, alpha=.7)
ax2.plot(x, y2, 'r-', linewidth=1, alpha=.7)
_ = ax1.set_ylabel(titul1, color='k')
_ = ax2.set_ylabel(titul2, color='r')
plt.xlabel('Time (sec)')
plt.tight_layout()
# plt.show()
return ax1, ax2
tstep = np.linspace(0, 4, 600000)[1] - np.linspace(0, 4, 600000)[0]
plt.clf();
plt.subplot(2, 2, 1);
plotyy(y[180000:190000, 0], y[180000:190000, 1], '', '');
plt.box(False);
plt.axis('off')
plt.subplot(2, 2, 2);
plt.plot(y[10000:, 0], y[10000:, 1], lw=.08, alpha=1);
plt.box(False);
plt.axis('off')
plt.subplot(2, 2, 3)
# spec=scipy.signal.periodogram(y[:,1],1/(t[1]-t[0]))
# plt.plot(spec[0],np.log10(spec[1]));plt.xlim([0,1500])
spec = scipy.fftpack.fft(y[:, 1]);
N = y.shape[0]
plt.plot(np.linspace(0, 1 / 2 / (tstep), N // 2), np.abs(spec[:int(N / 2)]), lw=2);
_ = plt.xlim([0, 1500])
plt.subplot(2, 2, 4);
plt.plot(y[10000:, 2], y[10000:, 1], lw=.08, alpha=1);
plt.box(False);
plt.axis('off')
plt.figure()
y = odeint(deriv, [0.1,0.1,0.], np.linspace(0, 1., 600000),args=(5e6, 2200)) # with w0=2500, get resonance or beating
plot_and_play(y)

plt.figure()
y = odeint(deriv, [0.1,0.1,0.], np.linspace(0, 1., 600000),args=(5e6, 2200)) # with w0=2500, get resonance or beating
plot_and_play(y)

#import os
#name='vanderpol_coupled_standalone'
#path='~/mmy/jup/models/'
#os.system(f'jupyter nbconvert {path}{name}.ipynb --to html --output {path}{name}')
#os.system(f'jupyter nbconvert {path}{name}.ipynb --to markdown --output {path}{name}')